Dealer Groups
Optimo Pathfinder reduces the burden of compliance and brings consistency and assurance that the calculations outputted are done accurately.

Integrations to save time
You can connect Pathfinder with other systems through our exiting partnership with Roar or by using our API to build a connection to other systems.
Pathfinder allows for time-cost efficiency, due to the ease of data entry, quick and holistic strategy modelling, and the resulting documents that can be the foundation for the statement of advice, so including it as part of an end-to-end solution lowers expenses and increases productivity, ultimately allowing for more profitable advisers, which benefits the dealer group as a whole.
Prioritising the interests of the client
Pathfinder makes it easy to demonstrate the strategy is in the client’s best interest.
It is product independent, so you can create a strategy with general assets classes, and then select products after a strategy has been chosen.
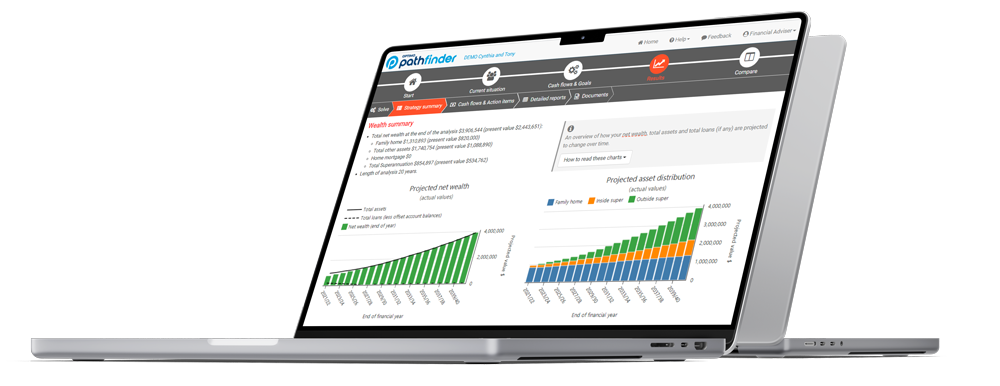
Pathfinder’s powerful algorithm can help identify strategies that will help maximise the client’s net wealth at the end of the analysis, such as working out where to allocate surplus cash and taking best advantage of government benefits.
It also makes it easy to compare strategies, which helps to demonstrate the value of the advice and helps their clients make an informed decision and justify the recommended strategy.

Prioritising the interests of the client.
Reduce your compliance burden by helping advisers making high quality strategies every time.
Optimo Financial has default assumptions built in for asset returns, interest rates and the economy (e.g. CPI). We can also set-up a custom assumptions database to overwrite the defaults and add new items with custom assumptions (e.g. a new profile for shares/managed funds). This makes it easy for all advisers across a dealer group to use the same assumptions.
It also includes up-to-date legislation that is updated regularly, so advisers do not need to keep track of it themselves.
Purpose-built for all forward-thinking financial professionals
Whether you’re a team of Financial Advisers, Accountants, Mortgage Brokers or Property Advisers, Pathfinder is your complete financial strategy solution, removing the burden of manual modelling and reports.
Financial Advisers
- Reduces the burden of compliance with an evidence-based process.
- Supports your recommended strategies with detailed reports.
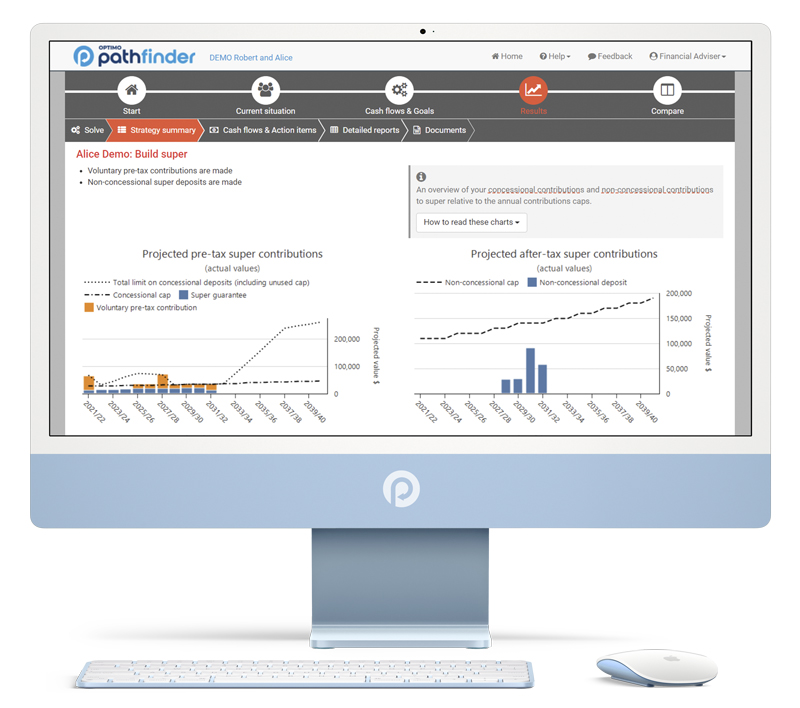
- Engage and educate your clients with live modelling to demonstrate your approach.
- Encourage client buy-in with your financial advice.
- Perform client reviews easily by updating new data and re-calculating a new strategy.
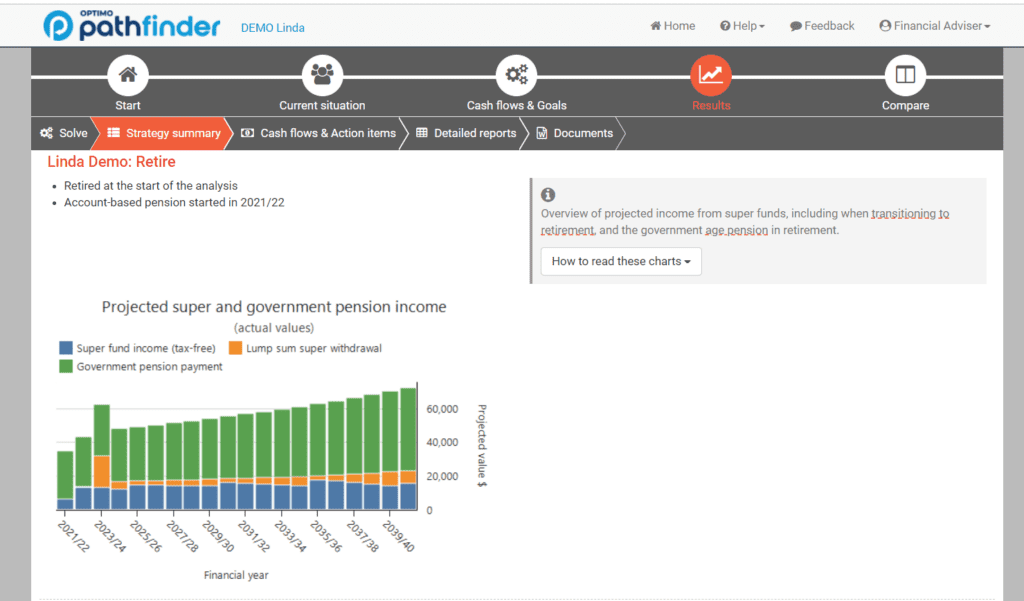
- Retain more clients with long-term projections
Accountants
- Provide fast client support with cash flow reports to help with budgeting.
- Model financial scenarios fast so you can discuss investment options with clients.
- Create detailed financial reports with tax calculations and rules to make it easy.
- Rest assured that Optimo Financial is independent of any product providers.
Financial Advisers
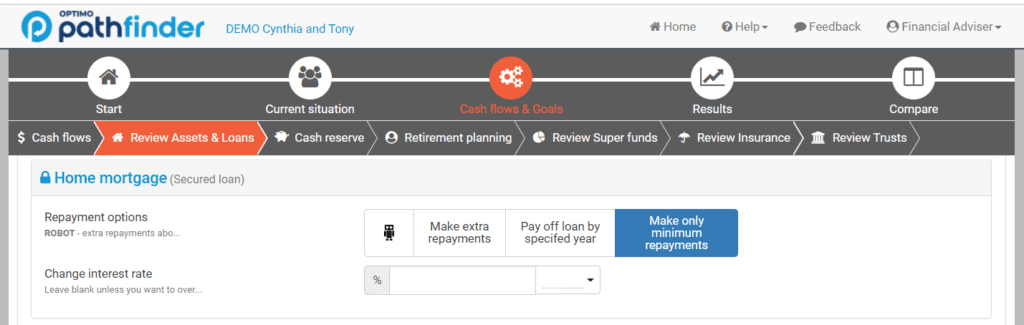
- Prepare for meetings and perform calculations before contacting lenders.
- Support clients with the financial organisation to prepare for investing
- Determine client borrowing capacity and repayments fast.
- Provide more-informed advice around long-term property purchases.
- Compare scenarios with a range of interest rates easily.